Unlocking Stock Market Insights with the Yahoo Finance API
Written on
Chapter 1: Introduction to Yahoo Finance Stocks API
In the realm of stock investment and Python programming, I've explored numerous APIs and tools to gather stock market data. My journey has been fraught with challenges like limited free services, transaction caps, outdated tools, and sluggish response times.
Nonetheless, several platforms have stood out as both effective and user-friendly, even with their restrictions on monthly transactions. Notable mentions include the Polygon API, yfinance module from Python, Google Finance API, and Rapid API’s Yahoo Finance and YahooFinance Stocks APIs.
While my experience with the Polygon API was brief, I quickly encountered a significant limitation: the inability to access more than two weeks of historical stock data in a single request. This restriction led me to seek alternatives.
The yfinance library offers a broad array of stock data attributes, but its slower transaction times can be frustrating—especially for web applications that demand quick responses. Similarly, my initial exploration of the Google Finance API revealed limited stock information and discrepancies between advertised features and actual offerings, such as dividend yields.
Among the tools I’ve utilized, Rapid API has proven to be the most reliable for stock data. Both the Yahoo Finance API and YahooFinance Stocks API are quick, free, and currently operational, though they do impose monthly transaction limits and necessitate an API key.
Despite the comprehensive capabilities of the Yahoo Finance API, today’s focus will be on the YahooFinance Stocks API—a fantastic resource for market data, albeit with slightly less depth. A detailed discussion of the Yahoo Finance API will follow in a later post.
What is Rapid API?
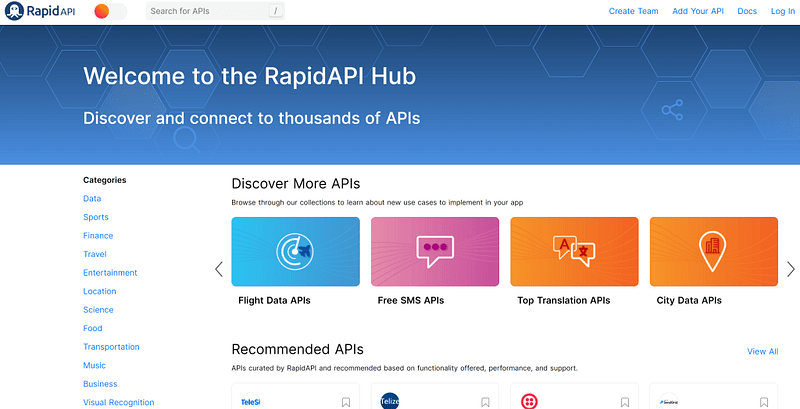
Rapid API is a premier platform for discovering, utilizing, and managing APIs across various sectors. It's favored by both individuals and businesses, with corporations often opting for the 'Enterprise Hub' for enhanced functionalities. However, it remains accessible for personal projects and research.
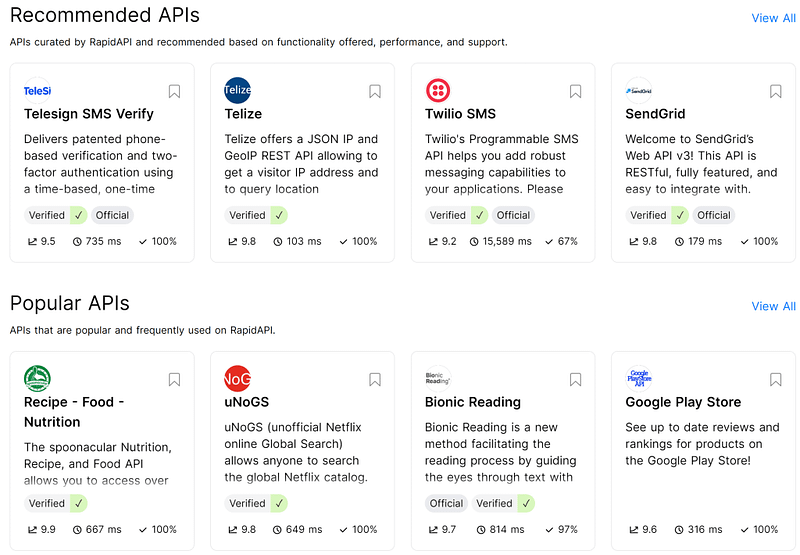
Users can browse APIs by category, with each listing featuring three key performance metrics: functionality rating, transaction latency, and user approval percentage. For instance, the Telesign SMS Verify API might show ratings of 9.5, 735ms, and 100%, indicating that the top APIs typically have the highest functionality scores and minimal latency.
Connecting to an API is straightforward and requires an API key, as previously mentioned. Users manage connections through the API Playground dashboard linked to their accounts. Rapid API supports multiple programming languages, including Python, JavaScript, C, Ruby, and R, with tailored connection options for each.
For instance, Python offers several methods for API interaction, such as http.client, Requests, and Unirest. Most APIs allow free usage up to a certain monthly transaction limit, making it suitable for light users, although higher tiers are available for those with greater demands.
Chapter 2: Getting Started with YahooFinance Stocks API
The YahooFinance Stocks API encompasses data from 75,000 stocks across 75 exchanges, boasting a 97% popularity score and approximately 1.8 seconds of latency. This API, powered by Yahoo Finance, provides a JSON-formatted endpoint for data retrieval.
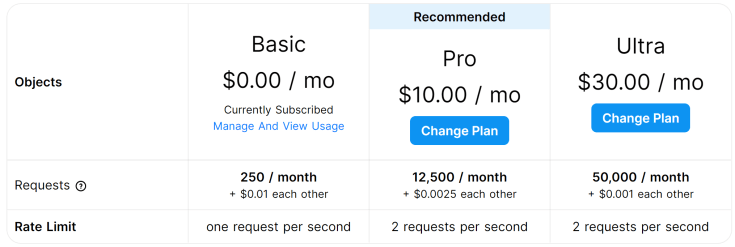
The service offers three pricing tiers, with the free version allowing for 250 transactions monthly at a rate of one request per second, which is what I opted for. However, there are higher tiers available for more intensive needs.
To start using the API, simply search for ‘YahooFinance Stocks’ in the API Hub or navigate to the ‘Finance’ section. From there, you can select the API from the displayed options.
The API playground offers a comprehensive management interface. A snapshot of the YahooFinance Stocks API dashboard reveals various data categories and a search bar for specific inquiries. Categories like Financials include items such as:
- Income statement
- Cash flow statement
- Balance sheet
Each attribute can be incorporated into the API call to access extensive data sets. Essential credentials for API access, including X-RapidAPI-Key (API key) and X-RapidAPI-Host (API hostname), are displayed prominently for easy reference.
A coding template for API implementation is also provided, automatically tailored to the selected programming language, simplifying the initiation process. For my examples, I chose Python, using the requests library to retrieve API data. The key API call is requests.get(), which requires four parameters:
- "GET" command: Indicates data retrieval
- Host website URL
- Header information: Includes the Rapid API key and hostname
- Parameters: Stock ticker symbol for data extraction
Once the API data is captured in the response variable, it can be accessed using the response.text command.
Chapter 3: Practical Examples with Python
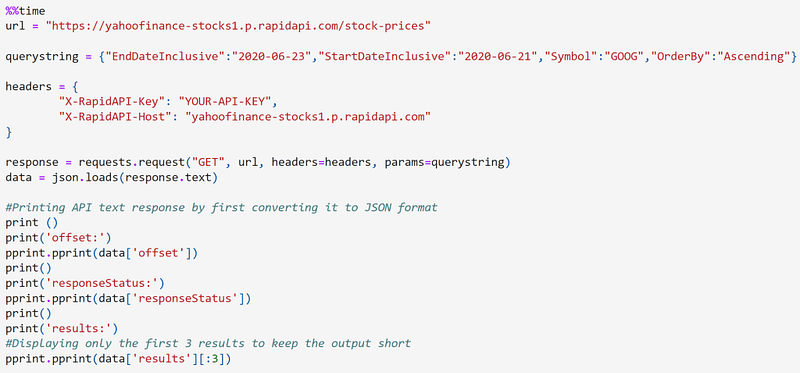
In this section, I’ll showcase several key API calls using Python, starting with the ‘stock-prices’ API call.
The stock-prices API call retrieves historical stock data, such as share prices over specified periods. The key arguments include:
- End date
- Start date
- Ticker symbol
- Date order
After retrieving the data, the response is converted to JSON format for easier handling. Below is an excerpt of the returned data, focusing on the 'results' attribute. The initial three entries illustrate stock price data from June 22–24, detailing opening price, closing price, volume, high, and low for each day.
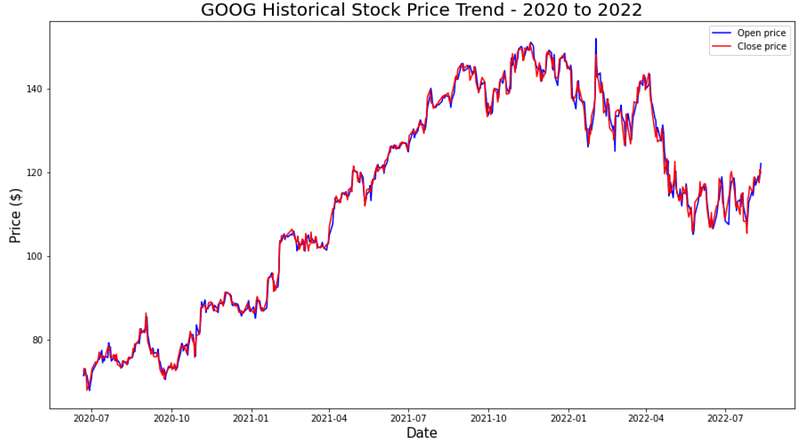
With further parsing, I was able to visualize the historical opening and closing prices for Google stock between July 2020 and July 2022.
Next, the ‘stock-metadata’ API call provides basic stock data such as price, market, and time zone. This call simplifies the query string to only require the ticker symbol.
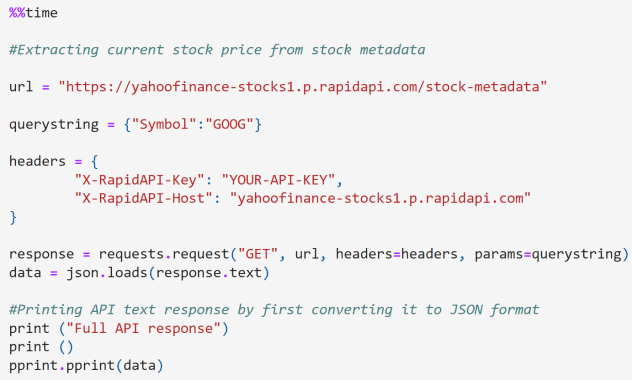
The metadata response contains several attributes, with more details available in the Python notebook.
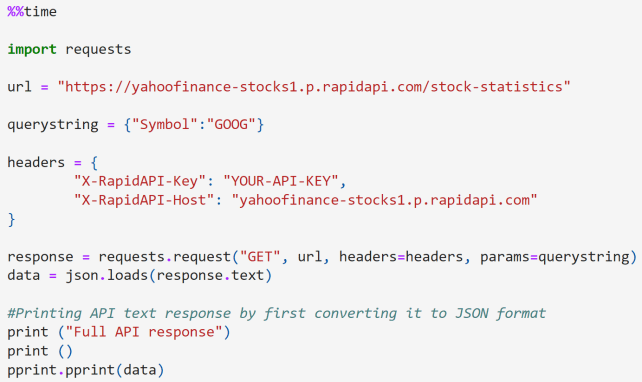
Finally, we’ll examine the ‘stock-statistics’ API call, which delivers detailed stock metrics like the price-to-earnings (P/E) ratio, price-to-sales (P/S) ratio, and earnings per share (EPS). These metrics are fundamental for stock valuation.
Similar to the previous example, the ‘stock-statistics’ API call requires only the ticker symbol.
Here are a few essential stock statistics retrieved through the code. The P/E ratio is calculated as the stock price divided by the EPS, with ‘trailing’ indicating the current ratio and ‘forward’ referring to future projections. The price-to-sales ratio is determined by dividing the stock’s market cap by the previous year’s total revenue.
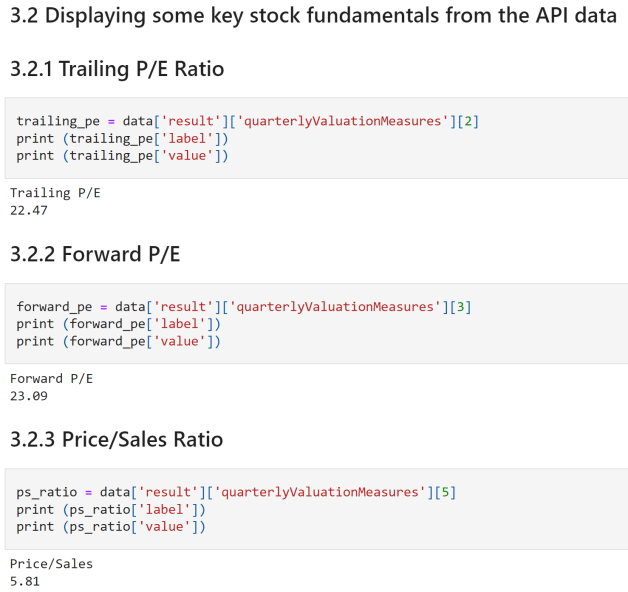
These examples represent only a fraction of the metrics available through the API. For a comprehensive list of attributes, I recommend exploring the Rapid API website. For additional details on the API calls, data parsing, storage, and analysis, please check out the code on my GitHub repository.
I hope this guide proves beneficial for those interested in exploring new APIs for stock market data. Feel free to share your experiences with different tools for extracting stock information in the comments below. Have you tried the API discussed here? What other significant features have you discovered? Cheers!
In this video, learn how to effectively utilize the Yahoo Finance API with Python and Excel, showcasing practical examples and tips.
This video focuses on extracting stock market data from the Yahoo Finance API using Python, offering step-by-step instructions and insights.