Building a Simple Sentiment Analysis Using Power BI
Written on
Introduction to Sentiment Analysis
This guide will walk you through the process of creating a straightforward sentiment analysis in Power BI. Before diving into the specifics, let's briefly explore what sentiment analysis entails.
Sentiment Analysis represents a prominent field in Natural Language Processing (NLP) and Computer Science. It involves utilizing NLP, text analysis, and statistical methods to assess text and classify it into negative, positive, or neutral sentiments.
Sentiment analysis tools are capable of processing a variety of languages, identifying sarcasm, and comprehending common abbreviations and slang.
Applications of Sentiment Analysis
Sentiment analysis can be applied across various sectors, including:
- Business
- Finance
- Politics
- Marketing
- Public Relations
- E-commerce
Getting Started with Sentiment Analysis in Power BI
To implement sentiment analysis in Power BI, we first need to prepare our data. We will utilize the IMDB Movie Review Dataset, which is publicly available. Follow the steps below to proceed.
Step 1: Installation
For this project, we will employ Python scripts in Power BI, using the NLTK Sentiment Intensity Analyzer library to analyze the data. This library assists in generating polarity scores to determine if the reviews are positive, negative, or neutral.
Use the following commands to install the necessary libraries on your system (note: this tutorial is based on Windows):
1 # install Pandas
2 py -m pip install pandas
3
4 # install nltk
5 py -3.9 -m pip install nltk
6
7 # After installing nltk, execute the following command to download the vader_lexicon
8 >>> import nltk
9 >>> nltk.download('vader_lexicon')
Note: Python version 3.9 is used for installation since this is the version connected with Power BI.
Step 2: Enable Python Scripting
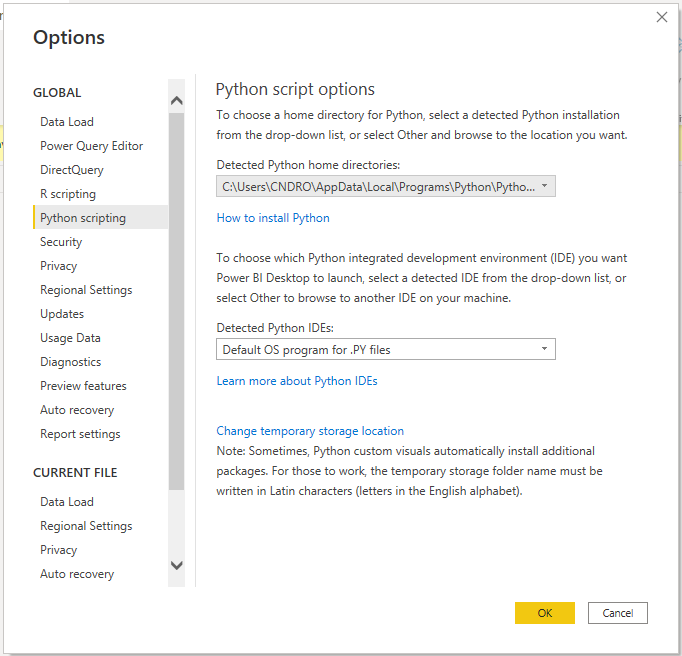
Next, we need to enable Python scripting in Power BI Desktop. To do this, navigate to File > Options and settings > Options > Python scripting. A settings page will appear where you can select the specific Python home directory you wish to utilize.
Here, I have chosen the Python 3.9 location on my machine, ensuring that all libraries are installed for this particular version to avoid any module not found errors.
Step 3: Import Your Data
After enabling Python scripting, the next step is to import your data into Power BI. Load your dataset and then proceed to transform it by selecting the Transform tab under the Home menu.
On the transform tab, you should see the following interface:
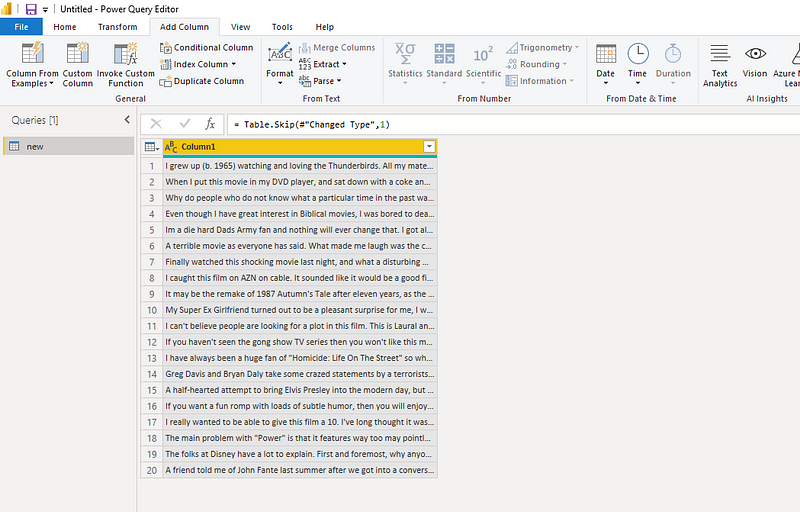
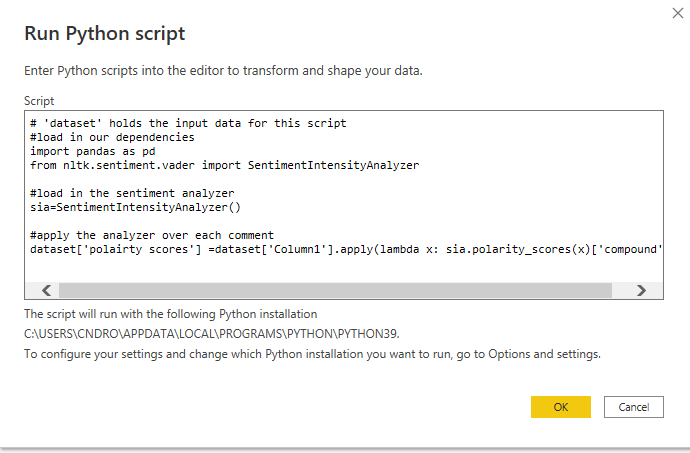
To utilize Python scripts, select the Transform tab and click on Run Python Script. This action opens an interface where you can input your code.
The following code calculates polarity scores with the NLTK Sentiment Intensity Analyzer, allowing us to classify the text as positive, negative, or neutral:
1 # Import the required library
2 import pandas as pd
3 from nltk.sentiment.vader import SentimentIntensityAnalyzer
4
5 # Create an object of the SentimentIntensityAnalyzer
6 sia = SentimentIntensityAnalyzer()
7
8 # Create a new column for polarity scores based on the data
9 dataset['polarity scores'] = dataset['Column1'].apply(lambda x: sia.polarity_scores(x)['compound'])
Note: In Power BI, "dataset" refers to the data you have imported.
Once you input your code, click OK.
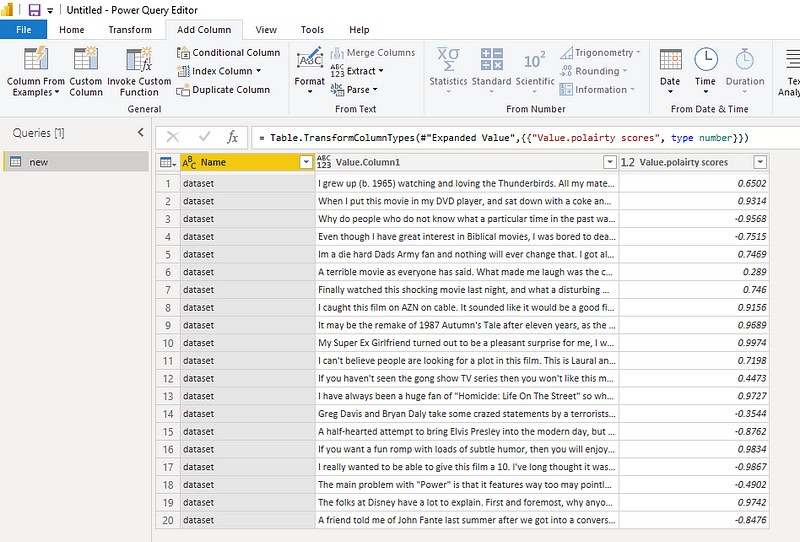
After executing the script, a new column named "polarity scores" will be generated in your table.
Step 4: Interpret Polarity Scores
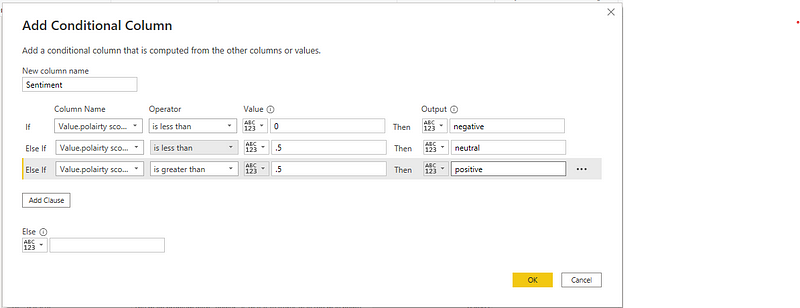
Now, we will interpret the polarity scores to derive our sentiment. To achieve this, we will add another column by selecting Add Column > Conditional Column.
In this new column, classify the polarity scores:
- Scores equal to zero as negative
- Scores less than 0.5 as neutral
- Scores greater than 0.5 as positive
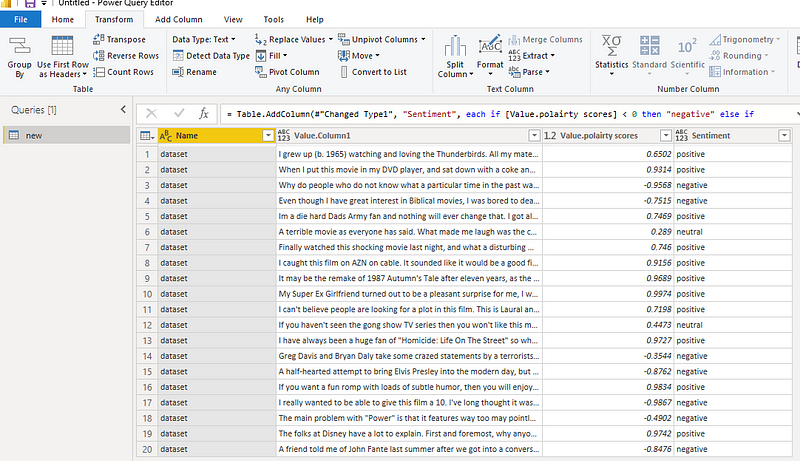
This classification will generate a new column titled "Sentiment."
We should now see a new column with the sentiment classifications.
Step 5: Create Your Chart
With the sentiment and polarity scores established, close the Power Query Editor by clicking Close & Apply. This action will take you back to the report page.
Here, you can create a table and a pie chart using the sentiment data and scores. Below is an example of a generated chart:
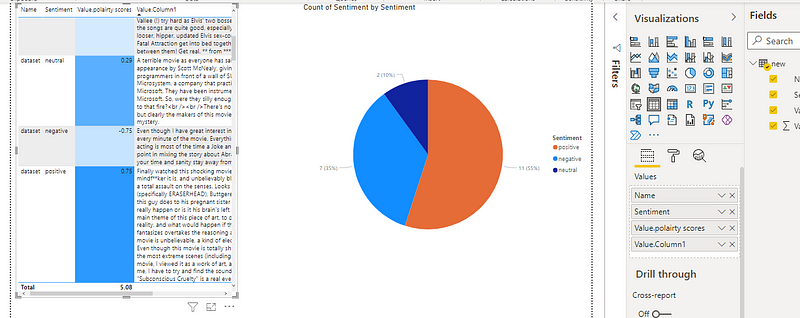
Now you have successfully built a sentiment analysis model in Power BI!
This video, titled "Sentiment Analysis with AI in Power BI Desktop," provides a visual overview of the process we discussed.
In this second video, "Sentiment Analysis with Power BI," you can find additional insights into the implementation of sentiment analysis using Power BI.